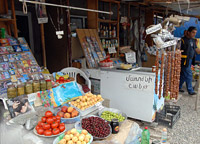
The National Statistics Service yesterday issued its report on the index of consumption prices for January-March 2012. More clearly, the official statistics has wrapped up the index of inflation for the three months of this year.
Let us mention at once that in a monthly comparison, in March, compared to February, the NSS has brought up consoling indexes. The consumption prices in March (compared to the previous month) grew by only 0,1%. As of the 12-month inflation (March of this year compared to March of the previous year), the inflation reached 2,2%. In the case of communality goods we have the same index. During the past one year the greatest inflation was noticed in the prices of alcohol and cigarettes – 5,3%. Let us mention that in the case of grocery (stapled) goods we even had some deflation – 0,1%. According to the NSS, the main impact was the deflation of the prices of fruits, dairy goods, sugar, natural and cooking oil – 3.0-0.2%. In the meantime, in five product groups 0.2-0.9% inflation was noticed and in the case of two the prices haven’t changed compared to the last year. In the product group of fruits in March 2012 compared to March 2011, 29,2% inflation was registered. And compared with February 2012 there was 3,0% deflation. In March 2012 compared to February the price of grapes reduced by 21.0%, apple – 9,9%, lemon – 5,2%, orange – 1.1%. Dairy products in 2012 compared to March of 2011 reached 4.9% inflation. In 2012 February compared with 1.4% deflation. 2012 In March of 2011 the comparison with the average egg prices increased by 5.5 per cent in 2012 registered in February compared with 0.9% deflation. The average price of sugar in 2012 March compared to 2011 increased by 25.1 percent. In 2012 compared with 0.7% inflation was recorded in February. Meat products in 2012 March compared to 2011 got up 11.1% inflation; in 2012 February – with 0.2% deflation. The NSS report mentions that in 2012 February compared to the previous year the other meat (khash as an example) grew by 4.5%, pork and mutton – 1.1% and 1.0% respectively; beef liver, heart – 1.0%, minced meat – 0.8% deflation. In 2012 deflation was recorded in February compared with the meat in the cities and the military, making 0.9% and 0.5% respectively. Bread products in 2012 March compared to 2011 deflated by 0.5%. In March 2012 compared to February of the same year there was 0.9% inflation rate. Fish products in 2012 March compared to 2011 March increased by 4.2%. In 2012 February there was 0.6% inflation rate in vegetables and potato products. In March of 2012 compared to March 2011 the inflation was 5.3%. In 2012 February there was 0.4% inflation rate. In 2012 March compared to February inflation was 0.2% in confectionery, and coffee, tea, cocoa – 0.4% and other products, soft drinks, alcoholic drinks and tobacco products is maintained in the previous month level. As you can see, compared to the previous month, the index looks better in the case of separate products as well as the inflation in general. Nonetheless, as you remember, the ones who do comparisons month by month, deserved the label “incompetent” by the president. However, in the case of prices, such a comparison is on behalf of the government. At any rate, we shouldn’t forget that the index of inflation for the first months of the year is quite conditional. It is not integral. March is not over yet and the NSS issued its report days ago and hasn’t taken into account the changes of prices on the last days of March. Previously there were cases when the increase of the price of cheese or sugar wasn’t recorded in the NSS report but in the next report the inflation index was corrected. The index of January-February is perhaps more accurate. Let us remember that that during February of this year the 12-month inflation index was negative. It means that the NSS recorded 0.9% deflation compared to February of the previous year. The prices of grocery products reduced by nearly two percent. Indeed, this is not a bad index. They could have easily concluded the report with this optimistic picture, however the NSS in its report attached an appendix, which showed a comparison with the index of the countries of the CIS and other states of the world. Unfortunately, the comparison doesn’t work on our behalf. First, in January of the current year in the aspect of inflation Armenia is leading among the countries of the CIS and others presented in the appendix. The index of January compared to February of this year amounted to 3.6%. There has been no higher index in any country. Only Belarus has slightly approached this index – 1.9%. In the other countries of the CIS this index didn’t exceed 1%. In February the situation has mildly improved. Compared to January in Armenia 0.9% inflation was recorded but we continue occupying a leading position in the inflation list. Compared to the end of the previous year, inflation in February amounted to 2,6%. Only Belarus is ahead us with 3.5% inflation. In all the other countries of the CIS the situation is much better. For example, in Ukraine and Kyrgyzstan in February (compared to December of the previous year) the prices grew by 0,4%, in Russia – 0,9%. In Azerbaijan and Turkey the index is the same. According to the NSS in the EU states there has been zero inflation for the same period. Let us also mention that according to our experts in April and May there is a little chance for inflation in April and May taken into account the upcoming parliamentary elections. At any rate, even if the prices grow no one will get too mad if the official statistics shows a different picture.

