Hrant Bagratyan
Part 1. ECONOMIC EQUILIBRIUM IN GLOBAL WORLD AND MEGAECONOMICS
Introduction. The 2008-2009 World Economic Crisis keeps on attracting economists’ attention. Despite the fact that in the 4th quarter of 2009 and the first half of 2010 the macroeconomic results in the majority of countries showed clear progress, specialists outline the Crisis’ incredible consequences on everyday life. For example, in the first 6 months of 2010 stock market indices would grow rapidly and then fall dramatically afterwards. From 01/01/2010 to 01/07/2010 Dow, Nasdaq, S&P500, CAC-40, FTSE 100, DAX, Shanghai Composite, Nikkei, Hang Seng, Brazil Bovespa, RTS would fluctuate weekly in the interval of ± 10%, demonstrating slow paces of growth. Economic stability is simply regarded as a stable system of continuous instability. Macroeconomic results have gone up, but the desired optimism is still absent. According to B.Bernanke, the recovery is “unusually uncertain”1. The special literature for crisis management quickly disappears from counters, as if the crisis is not the exception but its absence is. Two conditions are obvious here. First, the 2008-09 crisis was universal, economic, structural, and not just financial. Second, by summer 2010 we can see the continuation of the crisis. For example, in the 4th quarter of 2009 the US economy grew by 5%, in the 1st quarter of 2010 by 3.7%, whereas in the 2nd quarter of 2010 by 2.4% only2. Furthermore, some even speak about the crisis’ second wave3. Perhaps, we are dealing with the second, or third, fourth or even the fifth wave of the crisis. Here, we are practically speaking of a permanent crisis. And this is all beside the fact that around 5 trillion US Dollars were injected into the world economy. It becomes clear that even mass adoption of Keynes’ anti-crisis measures (along with the dominating neo-conservative economic policies) doesn’t create the desired outcomes. The task of stabilising the economic growth is unsuccessful. The traditional economic knowledge, based on modern microeconomics and macroeconomics, does not explain the crisis, nor does it indicate the effective anti-crisis measures to use.
Reasons and specificity of the modern economics crisis. There have been numerous researches that have tried to explain the 2008-2009 economic crisis. These researches do deserve attention, however, the traditional economic science, as we see, is unable to fully understand the crisis. In the end of 2008 our researches brought us to the conclusion that the traditional interpretation of the crisis and its explanation by terms and theories of modern macroeconomics is simply impossible. Then, an idea of a new basic economic science came about. First of all, let’s examine the data from Table 1. One can note that GDP dynamics in the researched countries in 2007-2010 is quite diverse.
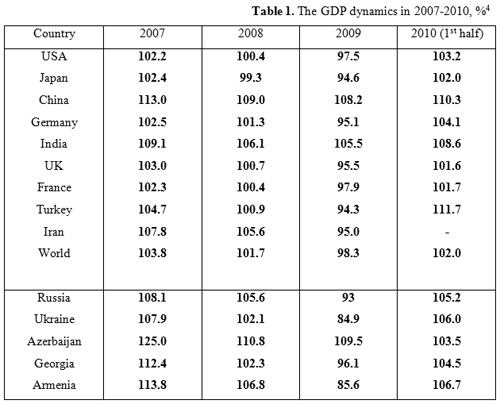
Analysing the table, we come to the following conclusions:
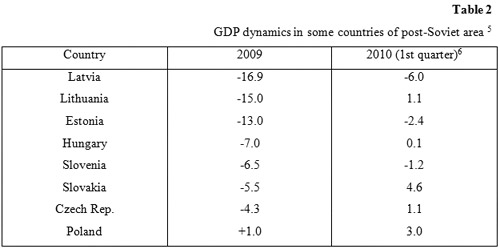
1. The countries that looked (look) to be the source of world economic crisis, where mortgage loans had a big share (e.x. just before the crisis in the USA, the UK and Denmark mortgage loans overall composed 130% to 300% of GDP or up to 210000 euro per capita), found themselves in a better position after recession. In contrary, post-Soviet countries suffered more, where eventually the economy recession proved to be 2 to 4 times heavier. This is when mortgage loans composed only 1% of GDP in Russia (134 euro per capita), 2% in Ukraine and 0.8% in Armenia. In the post-Soviet region GDP decrease was bigger. Data on Table 2 show that rapid slump in GDP growth was typical not only to post-Soviet republics, but also to the countries of Eastern Europe. Of course, the tendency wasn’t universal, as compared to post-Soviet countries or the West, the situation in Czech Republic or Poland was better, for example.
2. Crisis was weaker in countries where the sector of small to medium size businesses was strong and dynamic (Brazil, Turkey, Thailand), and in turn, was more crucial for countries dominated by monopolistic and oligopolistic structure (Armenia, Ukraine, Russia). Lesson from the crisis: changing business elite positively affects a crisis’ consequences.
3. Crisis was stronger in countries where the economy and its growth were diversified. In case when growth wasn’t diversified (Russia – oil export, Ukraine – metal products export, Armenia – construction), the abilities of respective governments to affect the pace of the crisis were limited.
4. The World Economic Crisis was stronger in countries where there was a deficit of workforce and weaker in countries with workforce surplus. The most complicated situation was in countries with a deficit of workforce compared to the potential GDP level, but at the same time with a negative population migration (Armenia, Latvia, Lithuania, Ukraine in 1991-2005).
5. The crisis was stronger in countries with mineral resources surplus (countries-exporters of mineral raw materials) and at the same time weaker in countries with a deficit of the same abovementioned resources.
6. Countries where the innovation wave in developing the economy was in the stage of intense realisation (China, India, Brazil) were affected less by the crisis, and in contrary, the crisis was much more crucial in countries where the innovation wave was in a more passive stage (Western countries; countries that rely on raw materials export; countries with economies mainly based on construction and financial services). We will carefully examine the last three conclusions and evaluate the impact of these and other factors that have affected the World Economic Crisis. For the beginning, one should note that the 2008-2009 crisis is the first world economic crisis during globalisation.
The global character of 2008-2009 World Economic Crisis. As it is known, the term “globalisation” was first used by J. Macklin in 1981. Together with him, such scientists like K. Popper, J.Attali, Zb.Brzezinski, F.Fukuyama, T.Levitt, J.Tobin, G.Soros, S.Huntington, M. Porter, J Stiglitz and others worked closely in determining the problems of globalisation. They even created a system to rank different countries, which in principle means different development tempos in different countries7. In general, scientists identify globalisation with economic, cultural and political aspects of various societies’ interosculation8. U.Beck argues that the sources of globalisation are communication technologies, ecology, economy, culture and civil society9. G.Diligenskiy and N.Rimashevskaya under the term globalisation understand a process of interaction between states, people, ethnos and social groupings of planetary level10. According to A.Ilyin, globalisation is the process of creating a united world with its own common contours and internal coherence11. All these approaches, and they are majority, are based on the assumption that during globalisation interosculation of economic institutions strengthens, whereas the movement of resources and capital becomes mobile.
There are, however, scientists that believe that globalisation doesn’t unite civilisations. Instead, it divides them. Several paradigms come to life as a result. For example, a Dutch scientist J.N.Peters suggests examining the following paradigms during globalisation: “battle” of civilisations, McDonaldisation of civilisations and civilisations’ hybridisation12. At the same time he outlines creation of four socio-cultural mega tendencies: cultural polarisation (increase of economic inequality, religious and market fundamentalism, claims to ethnic exceptionality, increase of terrorism and etc.), cultural assimilation (it aggravates F. Fukuyama’s theory that there is no alternative to westernisation), cultural hybridisation and cultural isolation13.
However, all the globalists are united by one common factor: as we understand, they assume that global can only considered a world, where the movement of at least one resource is practically not limited.
Global equilibrium. Unlimited movement of resources and goods, services, people, information and culture create the necessity of global (universal) equilibrium. On Chart 1 we see how intensively dropped down the average tariff rate from 25% to 8% in 15 years. And this tendency continues. Goods, services and resources, therefore, pass through national borders of countries more quickly and with less obstacles.
Mega-economics (geo-economics) is the world economy with already formed world-wide conditions for goods’, services’ and resources’ supply and demand equilibrium.
The specificity of this
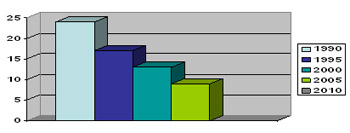
Chart 1. Golden years, world trade volume, World GDP and average tariff applied, 1990-2005(%)14
equilibrium is principally different from the rules of supply and demand curves in microeconomics and macroeconomics. Bearing this in mind, we will now analyse the last three reasons to the 2008-09 economic crisis mentioned above.
Disproportional (inadequate) distribution of labour force and consumption. Growth of world population for last 1000 years is presented on Chart 2. As we see, if world population almost did not change in the first millennium (in the beginning of our era world population was 300 million and remained almost unchanged for 1000 years), then for the second millennium world population increased for 21 times. One should note that growth is exponential: the bigger a population, the quicker it grows. Chart 2 clearly confirms this theory. The bar (block) curve, drawn on the graph, truly represents a classic exponential curve: it continuously grows everywhere, strictly bigger than zero. In the second half of ХХ century in 50 years’ time, world population doubled for the first time. Today, in the beginning of XXI century, world population grows yearly by 1.2-1.5%. Under these, equal conditions, next doubling of world population will take place within 45 years: in 2045 the Earth’s population will be 12 billion people.
Obviously, the growth of world population by itself cannot become a reason to the creation of a new economic discipline – geo-economics. However, the whole question is that population growth is uneven. For example, in the last 100 years world population grew in

Chart 2. Population growth exceeds growth of resources several times.15
average by 3.59 times, whereas the population of foreign European countries (the ones outside of former USSR borders) increased only 1.76 times. The Chinese population increased 2.5 times, the Indian 4 times, Africa’s 6.4 times, whereas the majority of Muslim countries grew by 6-8 times16. For the same hundred years the number of states grew from 53 to 208, whereas the world GDP grew approximately by 18 times. According to GDP per capita statistics, the distance between the richest and poorest states didn’t reduced. The current richest state (Luxembourg) is richer than the current poorest state (Burundi) 763 times17 (with Purchasing Power Parity).
In 70’s and 80’s of last century, a world market for labour practically didn’t exist: national legislation clearly prevailed over universal traditions. Moreover, capital markets, securities markets and markets for goods and services were more universal, than labour force markets. But nowadays labour force is more mobile. Possibly, the reason to this was not only globalisation as such, but the rapid improvement in literacy level all over the world. In the beginning of XXI century, according to World Bank, 90% of world population is literate18. It is one of the fewest statistics, where the vast majority of undeveloped states can actually compete with the most developed countries. By the number of students per 10000 people Eastern European countries are either equal or even outstrip the Western countries. On Chart 3 we can see that Ukraine, Russia and in some parts Armenia are clearly ahead of the West by the number of students. Estonia and Latvia have even reached the level, where almost all the youth gets educated (600-670 students per 10000). At the same time only 1/3 of this youth gets employed (except in Russia). Economies of these states are unable to absorb such a literacy level. Hence, the literate youth becomes a migrant even in countries, where the deficit of labour force is obvious (Armenia, South Caucasus countries, Baltic states). This educated youth emigrates from the country, subsidising the economies of developed states.
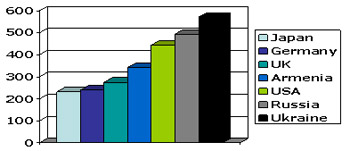
Chart 3. Number of students per 10000 population (2005)19.
Therefore, increase in world population’s literacy level and the strengthening of globalisation have rapidly increased people’s mobility and created the foundations to form the world market of labour force by the beginning of XXI century.
Migration: (main) source of economic growth. If we conditionally assume that the Earth consists of three civilisations (Christian, Muslim and Far Eastern civilisations)20, it will then be easy to notice that territories and populations (labour) are distributed extremely unequally (see Chart 4). The Christian population controls 62.6% of Earth (without Antarctic), while it only composes 27% of world population. For the Muslim civilisation these numbers are 23% and 23% respectively, and for the Far Eastern civilisation it’s 13% and 44%. We see that one of the production factors – land is distributed extremely unequally.
Now, let’s have a look at how the world economy is distributed between the abovementioned civilisations (Chart 5): 57% – Christian civilisation, 11% – Muslim and 28% Far Eastern.

Chart 4. Land and population distribution21
The unequal distribution of factors of production (in this case labour force) triggers the necessity to establish equilibrium in world economy. Just 30 years ago it was impossible to speak of such a function in economics as it was not global then. But now the birth and functioning of equilibrium curves for factors of production in world economy becomes a necessity. The suggested theory of mega-economics is the one to solve these problems.
So, there is a need for equilibrium. One of factors of production – labour force must be redistributed. Either capital, raw materials, land or innovation have to move towards labour force, or it has to move towards them. Our researches allow us to make the following axioma: in the beginning of XXI century, the tendency of people to move intensively towards capital, raw materials and technologies is more evident, than vice versa. This is

Chart 5. distribution of the economies, 200822
further proven by the fact that 28-33 million people migrate every year. So the number of migrants is more than 1/3 of world population growth. In 2000-2005 the average world statistics for migration was approximately 0.495-0.750%23.
Chart 6 confirms that in reality people move towards capital, and certainly not vice versa. The main stream of people came from China, India, Pakistan, Myanmar, Iran, Philippines, Bangladesh, northern parts of Africa and so on. The economies of those countries are still unable to fully and effectively absorb the labour force that has “grown”. We can note that people from Far Eastern civilisations, as well as the Muslim civilisation gravitate towards the Christian world. Economically speaking, this is totally logical. The only exception, however, is Mexico, even though the main stream immigrates to the USA, increasing the marginal product of labour force in the American economy and making it more competitive. Such migration allows equalise marginal products of labour force and capital, as well as the resources between various regions of world economy. The claim, suggested in the beginning of the research, which at the first sight looked somewhat strange is now clear: the 2008-2009 economic crisis was stronger in countries with a deficit of workforce, and was softer and less crucial for countries with labour force surplus. We can go further and see the specificity of this huge movement. 0.5-0.75% as the norm of migration is not just a movement of labour resources, but is also enough to trigger the movements of whole nations.
Now let’s see where the migrants are heading to: USA, Spain, Italy, Canada, Russia, United Kingdom and etc (see Chart 6). It is interesting that net importers have become also some nations from the Muslim world (Saudi Arabia, UAE). This confirms the suggested theory about the functioning of Geo-economy’s main role: establishing world equilibrium for marginal products of factors of production is an important condition to solve the equilibrium problem in economics. From this point of view, the immigration to Russia, USA, Spain, Italy, Canada and etc. is due to the demand created by those states. The reason to this is the fact that those countries get the chance to lower down costs per unit in production and make the national economy more competitive.
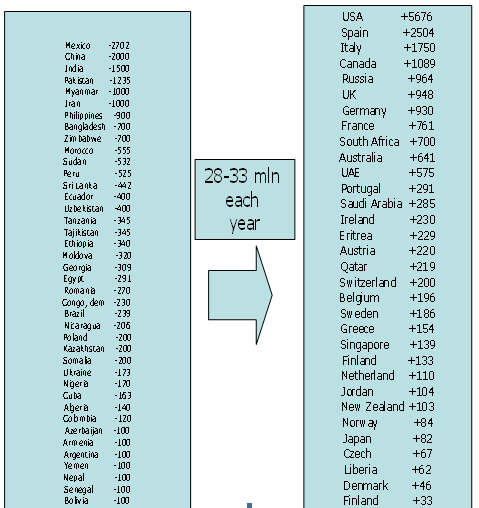
Chart 6. World’s net migration in 2005, thous. people24
Together with this, the immigrated labour force in these countries gets the opportunity for more economical and productive (innovative) application. This accelerates the formation of geo-economic equilibrium. People’s migration also allows to internationalise the economies of states and contributes to democratisation of societies.

Chart 7. 62% of migrants’ stream is in reverse direction, than the streams of mineral resources
Chart 7 visually demonstrates the direction of migration streams. There is no doubt that they have economic and only economic character. Other civilisations demand for more space, division of resources. Unfortunately, such objective processes may have disastrous consequences, when terrorism and criminal come about. This is because migrants can also be the source of terror, carriers of illegal drugs and etc. (September 11, 2001; London and Moscow underground, and Madrid train explosions). The mega-economic purpose for people’s migration is therefore due to unbelievably quick growth of world population and its spatial movement, which allows improving marginal product of labour force, returns the economic system to equilibrium and creates reserves for economic growth.
Capital export didn’t balance well the world economy. Charts 8 and 9 show that just before the World Economic Crisis, foreign direct investments were rapidly reduced. If in 2000 FDI (1.4 trillion US Dollars) was 4.4% of world GDP, in 2006 it was 2.4% only (chart 8). Furthermore, the main stream of FDI is directed towards developed countries (chart 9): these economies are reliable and trusted, even though average returns are low.
Hence, capital movement in the form of foreign direct investments didn’t help to establish equilibrium in world economy. First of all, the share of investments in the economy dropped, and second of all, investors preferred less profitable but more secure countries. This lowered the marginal product of capital and strengthened the tendency for people’s migration.
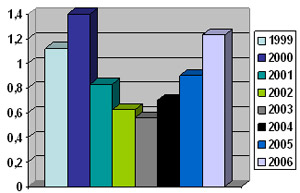
Chart 8. Foreign direct investments, 1999-2006, $trn25
Deficit of resources (raw materials) is becoming more apparent. If one resource of an economy – labour force, exponentially grows, then another resource – raw materials, reduces. Of course, reserves themselves sometimes may show tendencies for growth due to new fields’ discoveries. Regardless of that, however, mineral raw materials are becoming catastrophically less and because of that, they are more expensive to purchase. This permanently decreases the marginal product of this factor in the global economy.
Let us now analyse the data on table 3 regarding world oil reserves.
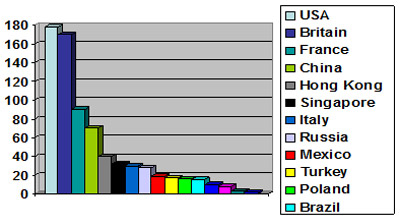
Chart 9. FDI inflows, bln$, 200626
Table 3, oil reserves (end of 2008)27
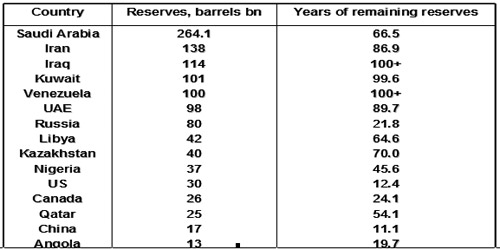
As table 3 demonstrates, world oil reserves (according to main country-producers) were 1225 billion barrels and able to satisfy demand for 73.3 years. During the period of 1970-2008 the price of one barrel of oil increased 27 times absolutely and 5.15 relatively (inflation adjusted)28. If we pick for comparison the peak of oil price in summer 2008, when it was 147$, the increase will be 40 times. Although the oil price had times of significant slump29 (due to positive impact of innovation wave), nevertheless, in the last 40 years oil became more expensive 1.66 times more quickly than the average tempo of world inflation. Therefore, if we count the increase in prices for other sources of energy, too, then energy intensity of world GDP went up from 8% to 14.3% within 40 years30. At the same time, 1.36% to 1.52% of oil reserves are consumed yearly. According to our calculations, this mineral raw material becomes less by 0.7-0.8% yearly (bearing in mind that numerous new oil fields are still being invented). If world population grows by 1.4% a year, then oil per capita becomes more than 1.4%, given that the pace of finding new oil fields doesn’t change. If the discovery of new oil fields and reserves stops, then oil resource per capita will decrease yearly by around 2%.
The reality may become much more complicated. Chart 10 shows specialists’ forecast for oil demand by 2030. Besides the fact that in the countries of North and South America, as well as in Western Europe the absolute volume of oil will reduce (if it does reduce, indeed), the rapid increase for oil demand in other countries will worsen the deficit of this mineral raw material. By the way, one should understand that little “savings” in developed countries thanks to more intense usage of innovation resources are unable to compensate the growing demand for energy in other countries. The problem is also more evident because of the fact that usually oil is produced by one states and consumed by others (see chart 11). The world economic equilibrium is most efficient, of course, under the scenario when resources move less, while people move more (because of economic reasons). Our calculations show that continents’ oil resources per capita are as follows: Eurasia – 211.6 barrels per capita; North America – 212; South America – 262 and Africa – 92 barrels.
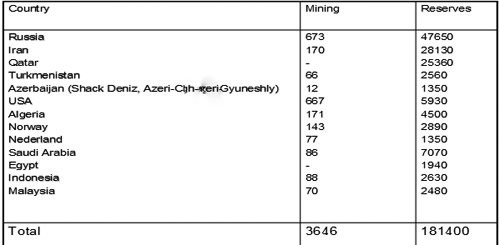
Let us now analyse the data from table 4 regarding the reserves and production of natural gas. Natural gas, of course, has a totally different scenario regarding the extent of its exploration, compared to oil – gas is a much less explorated product. Therefore, in the near
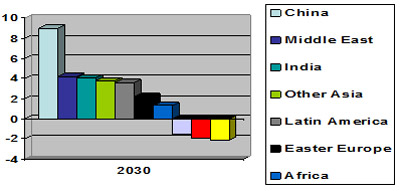
Chart 10. Oil demand, forecast change to 2030, barrels per day, m31,
future, the reserves for natural and other types of gas will strongly increase. The recent events in Poland and Ukraine, biggest reserves of slate (shale) gas after USA, and on Baikal (hydrates) confirm the idea that the reserves for gas used for energetic purposes will grow. Nevertheless, data on table 5 show that currently the world consumes yearly 2-2.1% of gas reserves used for energetic resources.

Chart 11. Oil production and consumption, 2007, bn. tons32.
A similar scenario is with coal. The yearly consumption of coal is at 7574 million tons, while there is 909064 billion tons in reserves33. This means that yearly 0.83% of coal is consumed. Another problem with coal is that unlike oil, it is distributed extremely unequally. Our calculations demonstrate that coal reserves per capita in North America is 526 tons, in South America – 45 tons, in Eurasia – 116 tons, in Africa – 62 tons and in Australia 3160 tons. Such distribution lowers the opportunity to use coal to stimulate equilibrium in the world economy.
Overall, when analysing reserves and consumption of other types of mineral raw materials (along with the abovementioned minerals – non-metall products, ores, gem materials, mining chemical materials), except from hydro resources, we can see that nowadays people use 0.7% of mineral wealth’s yearly. Bearing in mind the world population growth, one arrives to the conclusion that the deficit of resources per capita increases by more than 2% every year. This deficit must either be compensated by a rapid population growth (in that case, the deficit of mineral energy will be fully or partially compensated by the energy of living labour) or by the expansion of innovation wave that is able to compensate the decreasing quantity of raw materials.
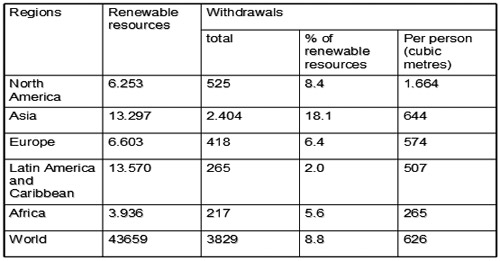
In hydro resources significant interest is in data regarding the reserves and consumption of fresh water (table 5). We see that water reserves are distributed extremely unequally as well. Calculations show that fresh water reserves per capita in North America is 12500 cubic meters, in South America – 35523 cubic meters, in Eurasia – 4675 cubic meters and in Africa – 4630 cubic meters. Therefore, water power, given that most of it is recyclable and also that its transportability as a resource is very high, can play a significant role in establishing geo-economic equilibrium and equalizing the marginal product in different regions of the world.
Hence, the limited quantity of raw materials, the increasing costs in their extraction and their unequal distribution (new fields are located further from the economic activities of people) bring us to the conclusion that raw materials as a factor is further more negatively affecting the world economy by misbalancing it.
The innovativeness of the economy, cyclic development and opportunities for equilibrium in world economy. The innovativeness of an economy, together with population growth is the resource that is capable of compensating the growing deficit of raw materials, and ensure the growth of world economy.
Table 4. Gas reserves and mining, bln cub, 200634.
Innovation as a resource of economic growth has a double effect on the economy. First of all, it stimulates the tendencies for management decentralization, democratization of the economy. The growing deficiency of world economy, as we imagine, strengthens the tendencies for centralization: there is the sensation that the centralization of managing the scarce resources improves the efficiency of their usage. Hence, the “struggle” of innovations against resources (raw materials) predetermines also the relationship between democracy and authoritarianism, and is an essentially important social consequence of relationship between these two factors of mega-economics. Second, it improves efficiency and lowers the relative expenditure of resources per unit. Let’s analyze this effect closely.
The economic development looks like the waves of scientific-technical or innovation cycles (IC): These cycles have the stages of accumulation (gathering – “H”), expansion (“E”) and resolution (“P”). At the same time, they cause the presence of certain social institutions
Table 5. Water world, water resources and withdrawals, km3 per year, 200035
because creating a new knowledge is a scientific task. Diffusion of that knowledge assumes a system for transferring knowledge (education), while its retention and realization are cultural tasks (including economic). These IC’s have been come right during our history.
Firstly, the duration of the cycles had been reduced from several thousands of years to several decades by the end of XX century. Thus, the invention of fire, wheel, bludgeon or bow required several decades of thousands of years, while attainments like religion, construction, irrigation, trade organization (occurrence and massive usage of money), took “only” several thousand years. Later, formation of banking and industrial technological systems, and securities market, took several hundred years, and tendencies of formation of mass science, socialization of yields of scientific and technological and many other activities took only several decades.
Secondly, character and level of coverage grade of ICs are changing from discrete to continuous and from local to global and international.
Thirdly IC’s , another pattern is shift in the forms of its results deployment, change of the methods of state interference within this process from centralized, forced and compulsive ways to decentralized and autonomic ways, by replacement of organizational role of the state with its regulating functions.
ICs IN NOW DAYS
The IC’s result is transition to the new technological system of organization of production. Per se, the process has the following timetable: science => scientific-technical result => innovation => production => reproduction.
For each case labor expenses are required to get a unite of product, but quantitative valuation of the product by consumers is different. Thus any innovation which is undoubtedly a scientific result, does not necessarily create interest of consumption. The circle of its potential consumers at this stage are people engaged in the scientific-technical development of that innovation. If total economic effect of an innovation is more than expenses on it’s development we can say that science < scientific-technical result < innovation < production < reproduction .
Lets pay attention to the chart 12. Here the output of produced commodities (XoYaYtXt) is a result of two already realized IC (areas H1 , E1 , P1 , H2 , E2 , P2 ) and the first two stages (phases) of the third IC (H3, E 3). So the chart presented beneath is a scheme of extended reproduction. The curve “а` ” characterizes IC. It allows via the permanent use of innovations to increase the utility degree of basic labor costs and to ensure the growth of aggregate production (supply) of goods and services. This isn’t just a proportional to the labor costs growth. There is a gain, increment of goods of services thanks to increase of labors specific utility. As we can see on the chart, the volume H1 (area X0Ya’Y1X1 ) is less than the volume of (area) X0YaY1X1 (the difference is triangle Ya’Ya Y1 ). In other words, at first stage of IC the society is induced to use a part of commodities, produced during the last stage of previous IC, as a resource in current term (the first stage of the next IC) for the expansion of scientific-technical activity and increase of quality of goods and services. Here (the period of time tx1- x0 ) the utility of labor increases. These are the resources of the current term saved (accumulated) for the next period. In addition due to the assurance of the given process relative losses of production volumes of the current term (area shaded in red) are totally compensated and overbalanced in the next term (E1 – the expansion stage of IC during tx2 – x1: shaded blue area) by the additional gain of output, which is conditioned by the increase of labor utility (area Y1Y1’ Y2 of the chart).
In the next, resolution stage of IC (within the period P1 tx 3 – x2 ) the society is again induced to postpone the consumption of some current commodities with a purpose of using them as a resource of the accumulation stage (H 2) of the next IC. During the phase (stage) P1 the volume of expended (used) labor force or current consumption again is less than potential level of production of the society. In other words, the tendency of relative reduction of production volumes dominates again (area Y2Y3’ Y3). The process continuous analogically during the next IC (H2, E2 , P2).
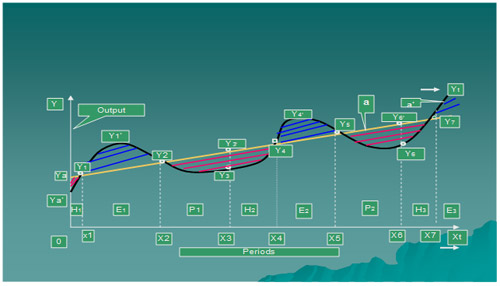
Chart 12. The output dynamics within phases of accumulation, expansion and resolution of IC.
Now let’s explain the reason of relative losses of the common production in a result of IC’s realization (stages of accumulation and resolution) and further growth (expansion stage). Here is important to mention that losses are in fact relative as in all cases they are limited to the maximum level necessary for current production level with perspective of future economic growth (in physical volumes), its quality (increase of usefulness of public-economic activities) and its dynamics. In other words, without deposition of the consumption of certain quantity of current resources it is impossible to guarantee future development of socio-economic system.
The abovementioned losses are relative simply because in the case of high tempos of innovations the curve “а” is ascending and starting with some level of acceleration of scientific-technical development (nondependent from the current fluctuations) P1 (area X2Y2Y3X3) is always more than E1 (area X1Y1Y2X2) and H1 (area X0YaY1X1). Respectively, P2 > E2 > H2 and on the whole generally Pi > Ei > Hi. Meanwhile, the additional absolute growth of commodities always take place at the expansion stage of IC, when there is continuous growth of utility of the unite of used labor force and relative losses of production volumes always occur at the stage of accumulation, when in result of active innovation activities the labor utility (value in use of an innovation) and its physical volume (value) are temporarily various. In the sequel the labor utility and its physical volume again are overlapped. The utility of an innovation increases the utility of expended labor unite.
The IC’s results.
1. At the accumulation stages, when a part of current demand is in deposition (postponed) a certain centralization of the state administration and public management and increase of intermediary and regulatory functions of the role of the state is observed increased. At the expansion stage a decentralization of the public management takes place and the economic role of the companies and individuals increases. This decentralization continues till the resolution stage at the end of which a stagnation and gradual reinforcement of the centralization tendencies are observed.
2. The meaning of progress is that the new opportunities provided by innovations (blue shaded area) not only compensate loss of the used resources, but also bring to added values. In other words, creativity of innovations should exceed their costs.
3. More the societies are involved in ICs, more the chances of success of the evolutionary development and less the need to radically change modes of public management of economy from decentralized and liberal methods to centralized and totalitarian ones. Inversely, week innovation activities generates a need of centralization in management (the society tries to compensate the loss of resources at the expense of economy of scale) and regularly bring forth to revolutionary changes in the economy via destructions.
Therefore, the innovativeness of an economy allows compensating the loss from rise in raw materials prices, decentralizing management of the economic system and return its equilibrium. The rises in innovation and migration capacity in an economy promote the acceleration of economic growth, while the rise in resources capacity pulls the economy down. This is the essence of the law on global economic equilibrium – the main law in mega-economics.
In the beginning of XXI century innovativeness of world economy significantly dropped. Innovation efficiency + population migration were unable to compensate the growing deficiency of resources (raw materials). Expenses in the stage of IC’s accumulation were unable to compensate the revenues on the stage of resolution, the growing deficiency of resources (raw materials). It was exactly due to this reason that the tendency for “losses” compensation (redistribution) came about. This was done thanks to activisation of financial markets by Western countries, in order not to allow (or at least slow down) the outflow of means to developing, post-Soviet and Third World countries.
Conclusion. In order to further develop the world economy, more equal distribution of resources is required. The suggested permanent redistribution of resources (land, capital, labour, innovation, raw materials) is the only opportunity for the world economy to develop. Geo-economy assumes permanent tendency of factors (resources) of the economy towards the following equation:
MPL/PC = MPC / Cf=MPR/Rex = MPI / Iv, where (1)
MPL is the marginal product of labour force in the world;
PC is the private consumption in the world;
MPC is the marginal product of capital;
Cf is the efficiency (revenue) from capital;
MPR is the marginal product of resources;
Rex is the revenue from sales of resources;
MPI is the marginal product of innovations and
Iv is revenue from innovation.
As a result of the abovementioned equilibrium, nowadays the movement of labour force (migration) is realized much more easier and economically is more beneficial than capital and goods and services transfers. Overall, it’s not capital that moves towards people, but it is people that move towards capital.
Mega-economics changes the character of equilibrium in macro and micro economics. If marginal product of one of the factors of production – labour force permanently rises, then marginal product of fixed factors – land and capital slowly decreases. In this case marginal product of the third factor – resources quickly decreases, while marginal product of the following factor – innovation is unstable (both rises and decreases). Under these circumstances world GDP is unable to establish equilibrium between the factors in the long run. Furthermore, the idea that starting from 2015 there could be possible tendencies for world GDP decrease does not look unrealistic36. At least, as it seems to us, the development of the theory about unequal contribution of factors of production in world growth shows that decrease in world GDP, partially or periodically, sometimes may become the only possibility to ensure economic equilibrium in cases, when no adequate measures of economic policy to ensure mobility of economic factors (resources) were taken. From this point of view, the development of world economy is in danger, as from one side, measures are being taken not to allow economic isolation and autarky within a country (WTO system), while from the other side, creation of regional economic (as well as political) unions (European Union, CIS, Eurases, SOC, NAFTA and etc.) create continental barriers for resources movement and deepen the crisis of world economic system.
Part 2. MEGA-ECONOMICS AND THE PROBLEM OF MEASURING ECONOMIC GROWTH
The problems of measuring economic growth. Mega-economics is concerned about growth efficiency and establishment of world economic equilibrium. From this point of view, the modern systems of quantitative measurements of economic growth in Geo-economics must be reassessed. The biggest cautions in Geo-economics create the national accounts systems (NAS), created by Simon Kuznets based on works by Ernst Laspeyres, Hermann Paasche and Irving Fisher. Let’s underline the most vulnerable sides of current national account systems (NAS). First: issues regarding the quality of economic growth. Many countries reach impressive tempo of economic growth thanks to rise in capacity of electricity production, increased pace of construction or thanks to rise in prices for goods exported. In table 6 we see that having spent 1$ of energy carriers some countries (Panama, Colombia, Switzerland, United Kingdom, Italy) ensure development (GDP) of 10$ or more, while others (Turkmenistan, Togo, Zambia, Ukraine, Russia) vary between 1.5-3$ only. For a GDP unit production Turkmenistan spends almost the same volume of natural resources. Of course, the table presented isn’t perfect itself. Principally, such data must be corrected by coefficients that count the natural conditions, under which the economies of abovementioned countries function. However, it becomes clear that GDP as an indicator cannot be a base for Geo-economics as the contribution of economies of separate states to the world economic development and supply of global economic system equilibrium is more important. An economy, where per unit GDP is spent at least as much or even more resources, is a serious barrier to world development, a lost opportunity. The indicator that will have to be a base for Geo-economics must neutralize the impact of energy output capacity (energy
Table 6. GDP per unit of energy use, 200737.
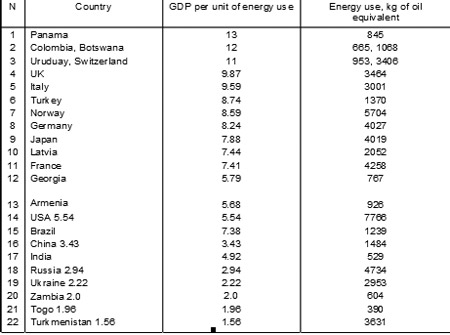
intensity) on gross output (GDP) growth. The same concerns the efficiency coefficients for other mineral resources usage.
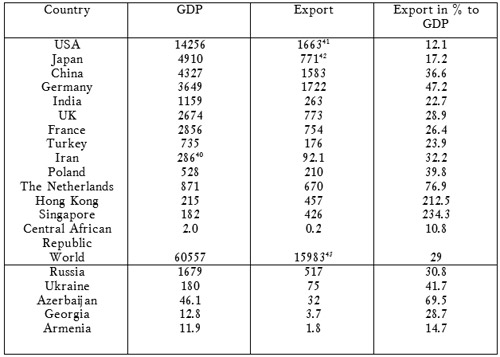
Second. Let us now examine the impact of export on output growth. First of all, we have to consider the connection between export of goods and services and GDP. Data on table 7 show that the extent of interrelation between export and GDP varies in big ranges for various countries. According to World Bank data, in 2008 the biggest relative exporter was the economy of Singapore – 234% of GDP. This indicator was the smallest in Central African Republic – 10.8%. Of course, the “exportability” of the economies of Singapore, Hong Kong (212.5%), Luxembourg (179%), Seychelles (131%), Macao (90%) and the Netherlands (77%) shouldn’t be unequivocally eulogized as often it is due to the abovementioned countries’ geographically beneficial location for transit, transfers and re-export. On the other hand, low results in CAR (10.8%), USA (12.1%) and Armenia (14.7%) do not necessarily mean lack of contribution into world economy by these countries and parasitism of the economies of these countries. First of all, one shouldn’t compare USA with Armenia, for example. Each single state of the first economy in the world plays a much bigger role than the whole economy of Armenia. If in the export indicator of the USA we calculate also the export of goods and services between the states, then the number 12.1 will significantly rise. Second of all, the US export is dominated by high-tech production (27% of export), while in Armenia this index is only at 2% of export (world average is 17%38). Nevertheless, the export of a country somewhat shows the country’s contribution towards the development of world economy and establishment of equilibrium in it. This is because when importing various products and services, the importing country recognizes the necessity of that production and confirms its worldwide importance. In the case with GDP, in relation to separate companies and enterprises, products and services of final consumption are taken into account. Self-consumption is not taken into consideration. In this case, why the production (services) that has been produced and consumed within a country in the sense of gross contribution of countries, must be equalized to produced and exported goods? From Geo-economics point of view, a benchmark country can be created for comparison.
Estimates show that such a country can be the one, which has approximately a population of 32 million, GDP (with current methodology) of 350-400 billion US Dollars, export of approximately 120 billion US Dollars, while innovation export must be 17-18% of cumulative export. As time goes by, these parameters can be changed. For example, Poland meets the parameters of the benchmark country. Comparing the American economy with the benchmark country, one should note that it represents a collection of 35-40 such economies, while the Chinese economy will include 20-25 of such benchmarks. Hence, one may be able to estimate the coefficient of macroeconomic “γ” corrections, which represents a set of coefficients γ1, γ2 and γ3.
γ = γ1 х γ2 х γ3, where (2)
γ1 – represents the correction coefficient of export depending on country size;
γ2 – represents the correction coefficient dependant on export volume;
γ3 – represents the correction coefficient of export and of macroeconomic indicators of production output dependant on high-tech production share in export.
Presumably the value of the abovementioned coefficients must be in the range of 0.8 ≤ γ1, γ2, γ3 ≤ 1.2.
The next problem with NAS is the inclusion of acquisitions and mergers in GDP. It is totally clear that at the same time no value is created. Because of this problem, the countries
Table 7. Export in % to the GDP in 2008, bln USD39
of post-Soviet area, where in the end of XX century and the beginning of XXI century western countries were buying assets, just before the 2008-2009 crisis had 10 to 40% growth of gross indicators. This also allowed for artificial encouragement of economic growth tempos before the crisis and rapid decrease of these tempos during the crisis. Chart 13 shows that overall during the first decade of XXI century the amount of absorptions and mergers was between 0.7 to 2.7 trillion US Dollars a year or 1.8 to 4.5% of world GDP. As it was mentioned above, their decrease after the 2007 peak This was one of the reasons that deteriorated the 2008-2009 World Economic Crisis.
Another disadvantage for NAS is the fact that the results of the financial sector operations are indicated, too. For example, depending on the level of financial sector growth
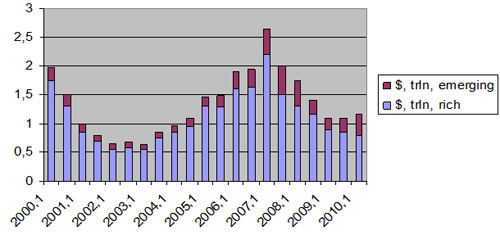
Chart 13. Global mergers and acquisitions 2000-2010, value $trn, red emerging markets, blue rich countries44
and on the amount of insurance and re-insurance of economic transactions gross output rises. In one country for each unit produced in the real sector of the economy’s GDP the amount of financial transactions may be more, sometimes even numerous times more, compared to another country. We have tried to compare the relative sizes of the financial markets in the USA, Russia, United Kingdom, Ukraine and Armenia. Our calculations show that the share of financial transactions for a single unit of production in the real sector in the USA is 1.5 times more than in the UK, 4 times more than in Russia and 12 times more than in Armenia (banks, investment and mutual funds accounts, and insurance market). These financial institutions, in turn, generate a certain volume of GDP.
Because of growing limitation of resources, the financial sector could not compensate the relatively growing deficiency of supply of resources for the real sector of the economy. The financial sector as though ignored the relative reduction of resources, shifted to grow incomparably faster than the prices of raw materials. The situation became much worse after 1999, when commercial banks were allowed to invest in business, factually becoming shareholders (such kind of activities by banks was forbidden after the Great Depression). Furthermore, the 4th group of normatives (investments) came to life and was officially recognized by the Basle committee. Only in the period of 2001-2008 credit default swaps in the world grew from 300 billion to 60 trln45. But how can a bank follow and monitor the given credit if it becomes a part of the business? Investment banks even adopted such intolerable activities. By autumn 2010 still no one had the idea to forbid the investing activities of banks. Banks should credit investments, and not become investors. This way, one of the main reasons for World Economic crisis is still not destroyed.
The financial services sector started to dictate the growth of the real sector of the economy, include the share of raw materials for the latter one. It is important to mention that the financial sector growth was 1.5-2 times quicker than the growth of prices on oil and other resources. Therefore, the financial sector strongly exaggerates the gross production (GDP and etc.) results for the countries with developed financial infrastructure. When estimating the geo-economic contribution of a particular country into the world economy, one should use the financial limiter coefficient relative to macroeconomic indicators. The value of that coefficient must be ≤ 1.
Finally, the traditional approaches to measuring economic growth (Laspeyres and Paasche formulas) more and more are disfiguring the essence of the economic growth: they are unable to embrace the quality of growth, sharp structural changes.
Therefore, the required size and the required indicator that reflect the “contribution” of one society into the world economy is equal to Sni = NI х β х γ х η – А , where (3)
NI – national income,
β – correction of NI depending on material (energy) intensity (capacity);
γ – correction of NI depending on state size and its export percentage of GDP (including high-tech industry exports);
η – financial limiter coefficient,
А – absorptions (mergers, acquisitions) volume.
It will require a huge statistical data for a long period of time (not less than the duration of IC) in order to use β, γ and η coefficients correctly. Our approximate estimates show that in the period 1995-2008, 1% of growth in the British economy, for example, equaled to 2% of one of the Russian, 3% of the Ukrainian and 4% of the Armenian economies.
Thus, in the context of globalization at least of one factor (resource) of the economy conditions of economic equilibrium change qualitatively. It is necessary to measure the contribution of any state in the world economy that radically redefines the concept of assessment of economic growth.
References
1. Bernanke: recovery ‘unusually uncertain”, http://money.cnn.com/2010/07/21/news/economy/bernanke_testimony/index.htm (accessed 21st July, 2010).
3. US recovery sputters, http://money.cnn.com/2010/07/30/news/economy/gdp/index.htm (accessed 30th July 2010).
4. Ukraine and new wave of banking crisis (Russian), http://news.mail.ru/inworld/ukraina/economics/4119570/ (accessed, 16th July, 2010).
5. Chub, Оleg О. 2009. Banks and global economy. Кiev: KNEU (Ukrainian).
6. Hoffman, Stanley. 2002. “Clash of Globalizations.” Foreign affairs magazine. July/August. 104-115 (http://www.foreignaffairs.com/articles/58044/stanley-hoffmann/clash-of-globalizations).
7. Beck, Ulrich. 2001. What is globalization? Moscow, Progress-Tradiziya (Russian).
8. Diligenskiy, German, and Nataliya Rimashevskaya 2001. Globalization, population, man. Moscow: Gorbachev foundation, vol. 7 (Russian).
9. Ilyin, Michail V. 2001. Political aspects of globalization.. Moscow: Gorbachev foundation, vol. 7 (Russian).
10. Kalchenko, Timur V. 2009. The global economy, Кiev: KNEU (Ukrainian).
11. The Economist, 2008, “Barriers to entry,” December 20th – January 2nd, 113.
12. Russian education: tendencies and challenges. 2009. Мoscow: Delo, ANE.
13. The economist. 2007. “Foreign direct investments,” January 20th – 26th, 109.
14. The Economist. 2007. “FDI inflows,” January 20th – 26th, 109.
15. The Economist. 2009, “Oil reserves,” June 13th -19th, .97.
16. http://inflationdata.com/inflation/inflation_rate/historical_oil_prices_table.asp, historical crude oil prices (accessed July 21, 2010).
17. The economist, 2008, “Oil demand,’’ November 15th – 21st, 110.
18. The economist, 2009, “Raising the stakes,” April 11th – 17th, 2009,.59.
19. The economist, 2009, “Sin aqua non,” 11th -17th April, 54.
20. Golansky, Michail M. 1999. Takeoff and fall of the global economy. Moscow: African Institute of RAS, Vol.6, pp.12-26 (Russian).
21. The Economist, 2010, “Global mergers and acquisitions,” Jul 1st
(http://www.economist.com/node/16486667?story_id=16486667),
22. The Economist, 2008, “Credit-default swaps (CDS), national amounts outstanding,” November 8th – 14th, 14.
——————————————————————————-
1. Bernanke: recovery ‘unusually uncertain”, http://money.cnn.com/2010/07/21/news/economy/bernanke_testimony/index.htm (accessed 21st July, 2010).
2. US recovery sputters, http://money.cnn.com/2010/07/30/news/economy/gdp/index.htm (accessed 30th July 2010).
3. Ukraine and new wave of banking crisis (Russian), http://news.mail.ru/inworld/ukraina/economics/4119570/ (accessed, 16th July, 2010).
4. http://data.worldbank.org/indicator/NY.GDP.MKTP.KD.ZG, GDP growth (annual %); http://ddp-ext.worldbank.org/ext/ddpreports/ViewSharedReport?&CF=1&REPORT_ID=9147&REQUEST_TYPE=VIEWADVANCED&HF=N&WSP=N, data profile; http://www.economist.com/node/16486687?story_id=16486687, http://www.economist.com/node/16846949?story_id=16846949, Output, prices and jobs, August 19th, 2010; http://www.ukrstat.gov.ua/, GDP changes in 2009, 01/04/2010; http://www.ukrstat.gov.ua/; dzerjkomstat ukraini, 19/08/2010; http://www.armstat.am/en/?nid=126, main indicators, Thursday, 19 August 2010, http://www.azstat.org/macroeconomy/indexen.php, macroeconomic indicators, 13/08/2010; http://www.geostat.ge/index.php?action=0&lang=eng, key indicators; http://www.geostat.ge/index.php?action=page&p_id=119&lang=eng, GDP.
5. http://www.economist.com/node/16645990?story_id=16645990; http://www.economist.com/node/16846949?story_id=16846949, Output, prices and jobs, August 19th, 2010.
6. For Estonia and Lithuania 2nd quarter of 2010.
7. Luxembourg has the largest index of globalisation according to KOF ranking, followed by Hong Kong (2), Ireland (3), The Netherlands (4), Singapore (5), USA (28) and etc. (Chub, Оleg О. 2009. Banks and global economy. Кiev: KNEU, p.17 (Ukrainian)).
8. Hoffman, Stanley. 2002. “Clash of Globalizations.” Foreign affairs magazine. July/August. P. 106.
9. Beck, Ulrich. 2001. What is globalization? Мoscow, Progress-Tradiziya, p.36-38,
10. Diligenskiy, German, and Nataliya Rimashevskaya 2001. Globalization, population, man. Moscow: Gorbachev foundation, vol. 7, p.116.
11. Ilyin, Michail V. 2001. Political aspects of globalization.. Moscow: Gorbachev foundation, vol. 7, p.57.
12. Kalchenko, Timur V. 2009. The global economy, Кiev: KNEU, p.17,
13. Kalchenko, Timur V. 2009. The global economy, Кiev: KNEU, p.18-19.
14. The Economist, 2008, “Barriers to entry,” December 20th – January 2nd, p. 113.
15. http://rhttp://www.k12science.org/curriculum/popgrowthproj/worldpop.html, historical estimates of world population, Source: US Census Bureau.
16. http://geosite.com.ru/pageid-563-1.html, the world’s population and it’s dynamics (Russian).
17. http://data.worldbank.org/indicator/NY.GDP.PCAP.CD
18. http://data.worldbank.org/indicator/SE.PRE.ENRR
19. Russian education: tendencies and challenges. 2009. Мoscow: Delo, ANE, pp.6-12; Statistical Yearbook of Armenia. 2009. Yerevan , p.106.
20. In civilisations the difference between people is best seen in religion. However, religion does not always divide civilisations properly. For example, the Far Eastern civilisation includes Hinduism, Confucianism, Buddhism and Daoism. All these religious confessions prevail in the region, where similar conditions and economic resources’ density is obvious.
21. http://data.worldbank.org/indicator/NY.GDP.MKTP.CD, GDP (current US$); http://www.economist.com/node/16645990?story_id=16645990, Output, prices and Jobs, July 22nd 2010. http://data.worldbank.org/indicator/SP.POP.TOTL, population, total.
22. http://data.worldbank.org/indicator/NY.GDP.MKTP.CD, GDP (current US$). http://www.economist.com/node/16645990?story_id=16645990 , Output, prices and Jobs, July 22nd 2010.
23. http://ddp-ext.worldbank.org/ext/ddpreports/ViewSharedReport?&CF=1&REPORT_ID=9147&REQUEST_TYPE=VIEWADVANCED&HF=N&WSP=N
24. http://ddp-ext.worldbank.org/ext/ddpreports/ViewSharedReport?&CF=1&REPORT_ID=9147&REQUEST_TYPE=VIEWADVANCED&HF=N&WSP=N
25. The economist. 2007. “Foreign direct investments,” January 20th – 26th, 109.
26. The Economist. 2007. “FDI inflows,” January 20th – 26th, 109.
27. The Economist. 2009, “Oil reserves,” June 13th -19th, .97.
28. http://inflationdata.com/inflation/inflation_rate/historical_oil_prices_table.asp, historical crude oil prices (accessed July 21, 2010).
29. For example, in 1970-1980 the oil price grew from 3.39$ to 37.42$ per barrel, however, by 1988 it went down to 14.47$. From 1998 to 2008 the oil price grew from 11.91$ to 147$ per barrel, while in 2009 it went down to 53$: http://inflationdata.com/inflation/inflation_rate/historical_oil_prices_table.asp, historical crude oil prices (accessed July 21, 2010).
30. Calculated by: http://data.worldbank.org/indicator/EG.USE.PCAP.KG.OE
31. The economist, 2008, “Oil demand,’’ November 15th – 21st, 110.
32. The economist, 2009, “Raising the stakes,” April 11th – 17th, 2009,.59.
33. http://www.bp.com/liveassets/bp_internet/globalbp/globalbp_uk_english/reports_and_publications/statistical_energy_review_2007/STAGING/local_assets/downloads/spreadsheets/statistical_review_full_report_workbook_2007.xls#’Coal – Reserves’!A1; http://ru.wikipedia.org/wiki/%D0%9A%D0%B0%D0%BC%D0%B5%D0%BD%D0%BD%D1%8B%D0%B9_%D1%83%D0%B3%D0%BE%D0%BB%D1%8C
34. http://www.bp.com/liveassets/bp_internet/globalbp/globalbp_uk_english/reports_and_publications/statistical_energy_review_2007/STAGING/local_assets/downloads/spreadsheets/statistical_review_full_report_workbook_2007.xls#’Gas – Proved reserves’!A1
35. The economist, 2009, “Sin aqua non,” 11th -17th April, 54.
36. Golansky, Michail M. 1999. Takeoff and fall of the global economy. Moscow: African Institute of RAS, Vol.6, pp.17-18 (Russian).
37. http://data.worldbank.org/indicator/EG.USE.PCAP.KG.OE
38. http://ddp-ext.worldbank.org/ext/ddpreports/ViewSharedReport?&CF=1&REPORT_ID=9147&REQUEST_TYPE=VIEWADVANCED&HF=N&WSP=N
39. http://data.worldbank.org/indicator/NY.GDP.MKTP.CD; http://data.worldbank.org/indicator/NE.EXP.GNFS.ZS; http://web.worldbank.org/WBSITE/EXTERNAL/DATASTATISTIC/0,,contentMDK:20535285~menuPK:64909260~pagePK:64909151~piPK:64909148~theSitePK:6950074,00.htmlж http://devdata.worldbank.org/AAG/arm_aag.pdf;
40. For 2007
41. For 2007
42. For 2007
43. For 2007
44. The Economist, 2010, “Global mergers and acquisitions,” Jul 1st
(http://www.economist.com/node/16486667?story_id=16486667),
45. The Economist, 2008, “Credit-default swaps (CDS), national amounts outstanding,” November 8th – 14th, 14.

